
How the weather affected product sales in 2021
The year 2021 is history, all reviews are written – almost all. After all, what about the weather and its influence on certain products? Which products saw a rise in consumer spending due to the weather, and which saw a drop? Using wetter.com weather data and GfK consumer panel data, we looked into this question.
The wetter.com review of 2021
Unsurprisingly, we’ll start with the conclusion: In terms of weather, the year 2021 can be summarized as rather average. Compared to 2020, it was somewhat cooler, with less sunshine and more precipitation. We took a detailed look at the measured values for the four largest German cities Berlin, Hamburg, Munich and Cologne.
Comparing the maximum temperature in 2021 vs. 2020 in Berlin
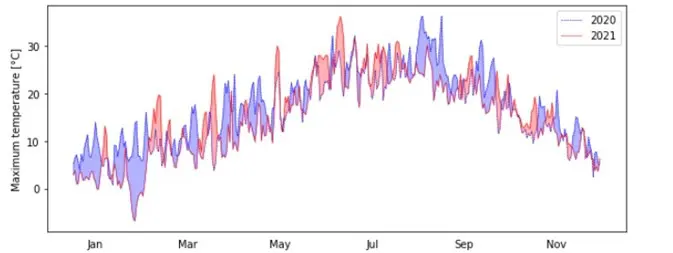
As an example for Berlin, the graph shows the course of the maximum temperature – the red line for 2021, the blue line for 2020. It quickly becomes apparent that there were significantly fewer phases with consistently higher temperatures in 2021 and that the colder periods dominate. On average, it was 1.2°C cooler in Berlin than in 2020. The situation is similar in the other cities.
Average decrease in maximum temperature 2021
Berlin: -1.2°C
Hamburg: -1°C
Munich: -1.4°C
Cologne: -1.6°C
If we look at the daily sunshine duration over the year, we see that the number of sunshine hours has decreased. As an example, Berlin is visualized again. The yellow line shows the course of the sunshine hours in 2021, the gray line the course for 2020.
Comparison of sunshine duration 2021 vs. 2020 for Berlin
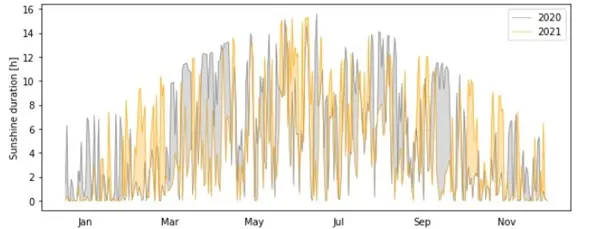
Here, too, it is noticeable that there were more phases with longer sunshine duration at a stretch in 2020, which is also reflected in the actual decrease in sunshine hours.
Average decrease in sunshine hours 2021
Berlin: -260 Stunden
Hamburg: -370 Stunden
Munich: -170 Stunden
Cologne: -300 Stunden
And what about rain? In Berlin and Hamburg, there was 50l/m² more precipitation each in 2021, in the Cologne area even 160l/m² more. In Munich, on the other hand, the values remained almost unchanged.
Weather effects on various products over the course of the year
To find out what impact the weather had on various products over the course of the year, we merged weather data with data from the main product groups in the GfK consumer panel. The influence of weather on product demand was calculated using a machine learning model. The model predicts demand based on various parameters, such as weekdays and local holidays, but also on weather parameters. Separating these weather parameters from the other factors, the weather effect on the product group can be calculated.
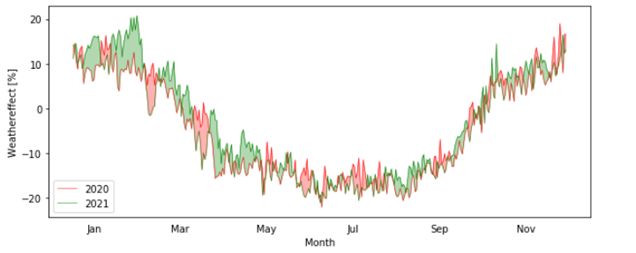
The following graph shows an example of the weather effect on demand for cold products in Berlin – the green line for 2021, the red for 2020. You can see that in the winter months, demand is supported by the weather by up to 20%, and in the summer months it is 20% lower. But you can also clearly see that the effect is not just seasonal, but that the weather effect on demand drops from +20% to 0% within a few days in February and then rises again to +10%. Conclusion: for the cold products, the weather effect can change up to 10% at the daily level from 2020 to 2021.
Comparison of the weather effect on cold products in 2021 vs. 2020 for Berlin
Looking at the year from a product group perspective, individual months are of varying relevance for different product groups: Things started off at the beginning of the year with an increase in demand for cold products – and this despite the fact that February ended rather unusually mild following a cold spell. The subsequent cold and gray spring led to lower sales of insect repellents (-6.2%) and garden furniture. In the short and rainy summer, interest in classic “good weather products” such as sunscreen and ice cream then went pretty much downhill. Stationary trade also had to contend with weather-related losses. A small ray of hope came from the brief summer comeback in September, which boosted beer and water consumption once again, enabling it to level off at the previous year’s level in the final spurt. And the cool temperatures in November meant that chocolate goods and frozen products were in greater demand.
Insect repellent: -6,2% (April 2021)
Garden furniture: -8,7% (April 2021)
Sunscreen: -12% (August 2021)
Ice cream: -11% (August 2021)
Stationary trade: -2,3% (August 2021)
Chocolate: +3,6% (November 2021)
Weather – an important optimization lever
These examples clearly show how much influence the weather has on our consumer behavior. It drives demand or can cause sluggish business. It is clear that we cannot change the weather, but we can use it to our advantage – whether in marketing or in sales planning. Weather data is very valuable data that offers great optimization potential, especially in combination with sales or other user data, and on many different channels.
More info?
Here you can download some of our latest case studies, which show you the optimization possibilities offered by our weather data-based solutions.

